
Introduction
The United States is the world's largest economy, and its fiscal and monetary policy carries weight for the rest of the world. In recent years US federal debt has kept climbing and the money supply has swung sharply, and these changes interact with GDP growth in complicated ways. This piece sets out to analyze the dynamic relationship among the US debt ceiling, the money supply, and GDP in a systematic way, covering how it has evolved historically, how theory explains it, and where it may go.
It starts with the concept of the debt ceiling and its economic significance, then analyzes how Fed monetary policy affects the money supply and how that connects to the level of debt. It goes on to the dynamic relationship between GDP, the money supply, and federal debt, and uses two key historical moments, the 2008 financial crisis and the 2020 pandemic, to examine the interaction concretely. It closes with the mainstream theories that explain the relationship among the three, and with recent developments and future trends.
The Debt Ceiling: Definition and Economic Significance
The debt ceiling is the statutory maximum that Congress sets on federal borrowing, the limit on how much the Treasury can borrow by issuing government securities (U.S. Debt Ceiling: Definition, History, Pros, Cons, and Clashes). The ceiling originally came from the Second Liberty Bond Act of 1917, meant to impose overall control on government debt during the First World War, and it was kept afterwards as a tool of fiscal discipline (U.S. Debt Ceiling: Definition, History, Pros, Cons, and Clashes). The ceiling itself does not determine government spending or the size of the deficit: those are set by the congressional budget. But when the accumulated stock of debt approaches the limit and the Treasury cannot borrow further, it may be unable to pay for spending it has already committed to (U.S. Debt Ceiling: Definition, History, Pros, Cons, and Clashes). So if the ceiling is not raised and the federal government exhausts its extraordinary measures, there is in theory a risk of an outright default on government debt, and the shock to the economy would be catastrophic. Economists estimate that if the federal government could not meet its obligations because of the ceiling, GDP would drop about 7%, a bigger fall than the Great Recession of 2008 (United States debt ceiling - Wikipedia) (United States debt ceiling - Wikipedia). The economic significance of the debt ceiling is therefore twofold: it is a tool Congress uses to constrain the growth of debt, and it is a potential systemic risk, because if it is not raised in time it turns into a manufactured fiscal crisis.
Because failing to raise the ceiling could leave the federal government unable to pay interest on Treasury securities, Social Security benefits, and government contracts on time, which would set off turmoil in financial markets and a recession, Congress has repeatedly acted to raise or suspend the ceiling to avoid a default (U.S. Debt Ceiling: Definition, History, Pros, Cons, and Clashes). By one count the ceiling has been modified, raised or suspended, dozens of times since the 1960s, climbing in almost every year (U.S. Debt Ceiling: Definition, History, Pros, Cons, and Clashes). Before 1995, raising the ceiling was generally treated as a routine fiscal formality and did not touch off fierce political fights (United States debt ceiling - Wikipedia). In recent years, though, it has often been used as a bargaining chip, and the standoff over "raising the ceiling" has played out again and again, at times shutting down parts of the federal government (U.S. Debt Ceiling: Definition, History, Pros, Cons, and Clashes). Whenever the ceiling comes close, the Treasury usually resorts to "extraordinary measures" to shuffle cash around and postpone a default while it waits for Congress to raise the limit (U.S. Debt Ceiling: Definition, History, Pros, Cons, and Clashes). If Congress eventually approves a higher ceiling or suspends it temporarily, the federal government can keep issuing debt to finance the budget deficit and avoid immediate spending cuts or default. The flip side is that raising the ceiling so often has let total federal debt climb to a historic high, which raises concerns about long-run fiscal sustainability (U.S. Debt Ceiling: Definition, History, Pros, Cons, and Clashes). As of early 2025 the statutory ceiling has been set at roughly $36.1 trillion, and the pressure of hitting it is back (U.S. Debt Ceiling: Definition, History, Pros, Cons, and Clashes).
The history of debt ceiling adjustments affects the money supply and GDP indirectly. On one hand, raising the ceiling means the government can keep borrowing to fund spending plans that have already been approved, which avoids a fiscal cliff and supports GDP. On the other, if the ceiling goes unraised long enough that markets start pricing in default risk, interest rates can rise and financial conditions tighten, which cuts the supply of credit (and so broad money) and drags on growth. During the 2011 debt ceiling crisis, the ceiling was raised in time, but the US credit rating was downgraded, markets swung, and growth slowed in the second half of that year. Or take early 2013: with the limit unresolved for a long stretch, the Treasury at one point could not issue new debt and had to fall back on cash management measures. Fortunately Congress passed the No Budget, No Pay Act, which suspended the ceiling temporarily and spared the economy a worse shock (United States debt ceiling - Wikipedia) (United States debt ceiling - Wikipedia). These cases show that the fight over the debt ceiling by itself affects market confidence and the interest rate environment, and through that the growth of the money supply and the performance of GDP.
Raising the debt ceiling is not the same thing as increasing the money supply. When the federal government borrows more, it usually raises the money by issuing Treasury securities to investors, which converts private sector deposits into funds in the government's account. If the public holds the debt, money has simply moved between the private and government sectors, and totals like M2 need not change. But if the Fed is at the same time buying those Treasuries through quantitative easing (QE), the central bank is injecting base money into the banking system in exchange for government debt, and broad money may rise as a result (the debt has been "monetized"). The interaction between Fed policy and debt is discussed in detail below. Broadly, the existence of the ceiling keeps attention on the size of government debt, but the frequency with which it is raised also reflects the steady growth in the US debt total. The historical data show that federal debt as a share of GDP spikes during wars and recessions, then falls back in periods of peace and prosperity (National debt of the United States - Wikipedia). The mechanism behind this involves the government borrowing to stimulate during downturns, along with accommodating central bank policy, which is exactly what we turn to next.
Fed Policy, the Money Supply, and the Level of Debt
The Federal Reserve, as the central bank, mainly uses monetary policy to steer the money supply and financial conditions, and through them economic activity and inflation. The Fed does not directly control broad money such as M2, but it can influence the money supply and credit creation indirectly through a set of tools: open market operations (buying and selling Treasuries and other assets to adjust bank reserves), adjusting the policy rate (the federal funds rate), reserve requirements (now abolished), and the interest rate corridor (paying interest on excess reserves), among others.
In the traditional framework, when the Fed cuts rates or buys bonds, banks are encouraged to lend more and firms and households to borrow more, which increases the supply and circulation of money. Raising rates or selling assets does the opposite, tightening credit and slowing the growth of money. After the 2008 financial crisis, for example, the Fed cut rates to near zero and ran several rounds of quantitative easing, which drove bank reserves sharply higher and put a lot of base money into the system. M2 growth did briefly top 10% at the time (M2 Money Supply Growth vs. Inflation - Updated Chart | Longtermtrends) (about 10.3% year over year in 2009), but because banks held large excess reserves and credit transmission was poor, the money multiplier fell, the expansion of money did relatively little to stimulate GDP, and inflation stayed low. The Fed also changed its policy framework after the crisis, controlling rates through tools like interest on excess reserves, which freed banks from the old constraint of scarce reserves and left reserve balances much larger and more volatile (Why the US money supply is shrinking for the first time in 74 years | Goldman Sachs). In general, modern central banks care more about setting interest rates than about controlling the quantity of money directly, because rates affect the cost of funding and the level of demand, are easier to measure, and correlate better with economic activity (Why the US money supply is shrinking for the first time in 74 years | Goldman Sachs).
There is some connection between Fed policy and the level of federal debt, though it is not a simple causal one. When federal debt is rising, and especially when deficits are huge, the Fed may ease policy to make sure markets can absorb the government's bonds without rates rising too fast. That cooperation is most visible in wartime or in a crisis. The famous historical example is the Second World War, when the Fed worked with the Treasury to cap yields on government debt and in effect financed the government's borrowing. Or take the 2020 pandemic: the federal deficit ballooned, and the Fed simultaneously ran extremely loose policy, buying Treasuries and mortgage-backed securities on a large scale and expanding its balance sheet from about $4 trillion before the pandemic to nearly $9 trillion by 2022 (Why the US money supply is shrinking for the first time in 74 years | Goldman Sachs) (The Rise and Fall of M2 | St. Louis Fed). The Fed buying government bonds this way amounts to supporting fiscal spending by "printing money" in the form of new base money, with a substantial share of federal debt ending up on the central bank's books (what people call "debt monetization"). It explains why M2 grew faster during the pandemic than at any point on record: from February 2020 to February 2021, M2 rose 27% year over year, an all-time high (The Rise and Fall of M2 | St. Louis Fed). That was faster than during the high inflation of the 1970s and 1980s, or during the QE period after 2008 (The Rise and Fall of M2 | St. Louis Fed). A large part of the reason is that the trillions of dollars of relief the government sent out turned directly into household and business deposits, and the liquidity from the Fed's bond buying added to it, driving M2 up sharply (The Rise and Fall of M2 | St. Louis Fed).
On the other side, the Fed does not set its policy targets according to the level of government debt. Its statutory mandate is maximum employment and price stability. So if high debt is not clearly pushing up inflation or threatening financial stability, the Fed will not tighten simply because "debt is high". But changes in the level of debt tend to come with the business cycle, and Fed policy does respond to the cycle. In a recession the debt ratio rises and the Fed usually eases; when the economy overheats and inflation rises, the Fed will hike even if debt is high. 2022 to 2023 is one example: US federal debt was above 120% of GDP after the pandemic, and the Fed still raised rates sharply and repeatedly (the funds rate went above 5%) and started shrinking its balance sheet in order to bring inflation down. That pushed US M2 into a year over year decline at the end of 2022, the first since the 1940s (The Rise and Fall of M2 | St. Louis Fed). By one count, M2 fell by roughly $700 billion from the start of the hiking cycle (early 2022 to mid 2023). Savings deposits dropped about $2.4 trillion, partly offset by increases in other components of money (Why the US money supply is shrinking for the first time in 74 years | Goldman Sachs). M2 shrank mainly because higher rates pulled money out of checkable savings and into time deposits and money market funds that are not counted in M2, and because the Fed's balance sheet runoff squeezed the deposits available to banks (Why the US money supply is shrinking for the first time in 74 years | Goldman Sachs). Fed tightening, in other words, was aimed at the macroeconomy and the inflation target. It slowed money growth as a result, but was not directly about controlling debt. If anything, higher rates raised the government's cost of financing its debt, which puts pressure back on the budget and raises concerns about debt sustainability going forward.
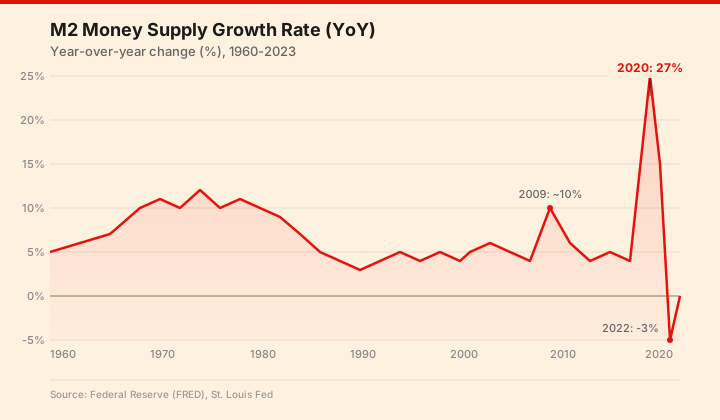 Chart: annual year over year growth in the M2 money supply (1960 to 2023). M2 growth spikes to an all-time extreme of 27% in 2020, then falls fast into negative territory during the Fed's 2022 hiking cycle, the first contraction since the 1940s.
Overall, Fed policy affects the growth of the money supply by way of financial conditions. When federal debt jumps and the economy is weak, policy tends to be looser (2008, 2020), so money and debt expand together (M2 Money Supply Growth vs. Inflation - Updated Chart | Longtermtrends). When the economy overheats and inflation is high, tightening can hold the money supply down, even though it means a heavier interest burden on all that debt. In recent years Fed officials and researchers have generally concluded that broad money growth correlates weakly with economic activity, so they no longer use the money supply as a direct policy indicator (Why the US money supply is shrinking for the first time in 74 years | Goldman Sachs). As Richmond Fed research pointed out, between 1965 and 1992 the contemporaneous correlation between M2 growth and nominal GDP growth was only 0.31, and close to zero once the trend was removed (How Useful Is M2 Today?). Short-run swings in money and GDP do not line up, and the mechanism behind that is that changes in interest rates shift people's preference for holding money, so M2 and its velocity move in opposite directions (How Useful Is M2 Today?) (How Useful Is M2 Today?). The Fed therefore works on demand through rates and market expectations rather than targeting a particular money supply number (Why the US money supply is shrinking for the first time in 74 years | Goldman Sachs). In extreme situations, though (default risk from the debt ceiling, or inflation from monetizing a huge deficit), the Fed also has to balance financial stability against controlling inflation. That is what the interaction between monetary policy and fiscal debt looks like: each goes its own way in normal times, and they constrain or accommodate each other when things get messy.
How GDP, the Money Supply, and Federal Debt Move Together
There is no fixed proportional relationship among GDP, the money supply, and federal debt. It shifts with the economic environment and the policy mix. One important linking indicator is the velocity of money, usually measured as nominal GDP divided by the money stock, that is, how often each unit of money is used to buy final output over a given period (Velocity of M2 Money Stock | Chart & Indicators). As a formula, the velocity of M2 = GDP / M2. It captures how actively money is turning over in the economy (Velocity of M2 Money Stock | Chart & Indicators). High velocity tends to go with strong transaction demand and confidence, while low velocity means a lot of money is sitting idle, which is typical of a weak economy or of a financial system that prefers safe assets (Velocity of M2 Money Stock | Chart & Indicators).
The historical data show that M2 velocity in the US is not constant, and has gone through clear trends. In the second half of the twentieth century it fluctuated roughly between 1.7 and 1.9. In the 1990s it rose with information technology and financial innovation, peaking around 2.19 in 1997 (Velocity of M2 Money Stock | Chart & Indicators). Over the next two decades it fell steadily, reaching a record low of about 1.10 during the 2020 Covid crisis (Velocity of M2 Money Stock | Chart & Indicators). The factors behind the recent decline include: 1) sustained easy money kept the money supply growing faster than nominal GDP, so it was not absorbed right away (Velocity of M2 Money Stock | Chart & Indicators); 2) in a low rate environment banks were less willing to lend, credit expansion slowed, and less money circulated in the real economy (Velocity of M2 Money Stock | Chart & Indicators); 3) demographic change, with the baby boomers retiring and spending less and younger generations preferring to pay down debt first, lowered how often money changes hands (Velocity of M2 Money Stock | Chart & Indicators). Changes in the ratio of GDP to M2, that is velocity, reflect changes in how economic actors behave and what they prefer. When people save more and hoard cash, the money supply can surge while GDP growth lags, and velocity falls. When credit is active and consumption is strong, velocity rises.
 Chart: the long-run trend in M2 velocity (nominal GDP / M2), 1960 to 2023. After peaking at 2.19 in 1997 it declined steadily, hitting a record low of 1.1 during the 2020 pandemic, which reflects a large stock of money sitting in the financial system rather than circulating in the real economy.
Looking back over the past several decades, the dynamic relationship between GDP, money, and debt can be summed up as growing together in the long run, unstable in the short run. Over the long run, as the economy has grown larger, GDP, broad money M2, and total government debt have all trended up. Their average annual growth rates differ by period, but all are above zero and positively correlated. Between 1960 and 1990, for instance, US nominal GDP grew about 7% a year and M2 about 8.1% a year, and the two trended together over time (M2 Money Supply Growth vs. Inflation - Updated Chart | Longtermtrends). The historical data confirm that the money supply tends to expand along with the economy (M2 Money Supply Growth vs. Inflation - Updated Chart | Longtermtrends). In unusual periods such as wars and recessions, federal debt and M2 also often climb quickly together (M2 Money Supply Growth vs. Inflation - Updated Chart | Longtermtrends). Put another way, whenever the government borrows to spend on a large scale (war financing or economic stimulus), it usually comes with central bank easing or credit expansion in the banking system, which raises the money supply to match (M2 Money Supply Growth vs. Inflation - Updated Chart | Longtermtrends). You can see this in the Second World War, in the easing after the dot-com bust in 2001, in the 2008 financial crisis, and in the 2020 pandemic. Over the short cycle, however, the correlation between GDP growth and M2 growth is weak, and in different periods the relationship can run in completely opposite directions. Sometimes money surges while GDP is weak (2009). Sometimes GDP rebounds while money growth slows (2022). As Fed research pointed out, from 1965 to 1992 the contemporaneous correlation between M2 growth and nominal GDP growth was only 0.31, and after removing the trend it was 0.044, essentially zero (How Useful Is M2 Today?). The short-run divergence comes from swings in the velocity of money and from policy responses. When rates fall, people are more willing to hold demand deposits, so M2 rises without GDP necessarily rising with it. When rates rise, part of M2 leaves (savings shifting into bond investments), so M2 growth slows or turns negative while nominal GDP may keep growing because of inflation and other factors, which raises velocity (How Useful Is M2 Today?) (How Useful Is M2 Today?). So GDP = M2 × velocity, with velocity acting as a buffer that makes the simple correspondence complicated.
For the relationship between federal debt and GDP, the common measure is the debt to GDP ratio, which gauges the debt burden against the size of the economy. The historical data show that the US federal debt/GDP ratio moves sharply around major events. It peaked at about 119% at the end of the Second World War, then fell all the way to about 30% by the 1970s thanks to fast growth and fiscal surpluses. It started rising in the 1980s with the Reagan tax cuts and higher military spending. It was around 60 to 65% just before the 2007 financial crisis, and after the 2008 to 2009 crisis it jumped to about 86% (end of 2009) because of the recession and rescue spending (Table Data - Velocity of M2 Money Stock | FRED | St. Louis Fed). It kept rising in the following years and crossed 100% around 2013, then eased slightly or held steady once the crisis passed. 2020 sent it straight up: from about 100% in 2019 to about 125% in 2020 (U.S. Debt to GDP Ratio 1989-2025 | MacroTrends), a rise of more than 24 percentage points, a record high (U.S. Debt to GDP Ratio 1989-2025 | MacroTrends). It then fell back to around 110% in 2021 to 2022 as GDP rebounded (U.S. Debt to GDP Ratio 1989-2025 | MacroTrends). Movements in the debt/GDP ratio come down to a race between GDP growth and debt accumulation: if debt grows faster than GDP the ratio rises, and if not it falls. In 2020 GDP shrank while debt exploded, so the ratio naturally jumped. In 2021 to 2022, nominal growth (including inflation) was high and debt grew relatively modestly, so the ratio actually came down (U.S. Debt to GDP Ratio 1989-2025 | MacroTrends). Over the long run, as long as nominal GDP grows faster than debt, the ratio falls. In practice the US has never brought its debt ratio down much through a long stretch of fiscal surpluses. It has relied more on GDP growth and moderate inflation to "dilute" the debt (National debt of the United States - Wikipedia). Keeping the economy growing is therefore essential to debt sustainability, and money supply growth that is too low, if it produces deflation and stagnation, actually makes the debt burden heavier.
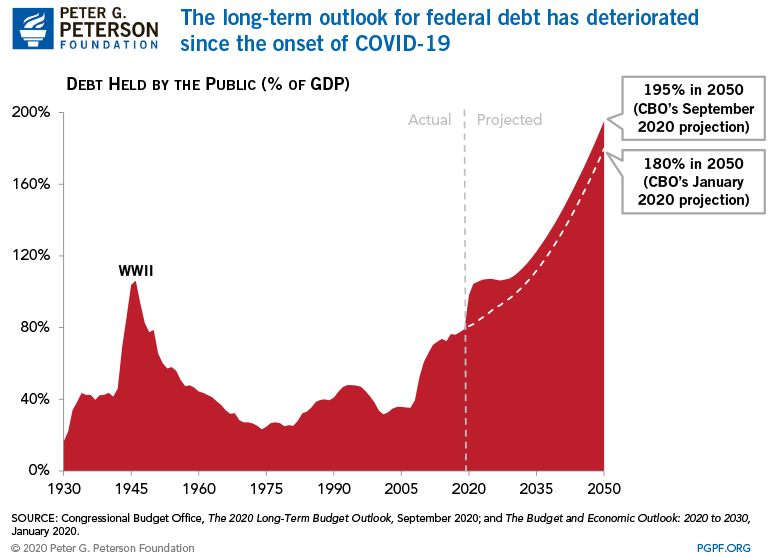
(13 Charts That Show the Stunning Impact of 2020 on Our Fiscal and Economic Outlook) Chart: US federal debt as a share of GDP (%), 1900 to 2050. It shows debt as a share of GDP rising sharply during wars and recessions (the Second World War, the 2020 pandemic) and falling back in periods of peace and growth. But the recent ratio (after 2020) is at an all-time high and is projected to keep climbing (National debt of the United States - Wikipedia) (U.S. Debt to GDP Ratio 1989-2025 | MacroTrends). The solid line is actual, and the dashed lines are the Congressional Budget Office (CBO) long-run projections from before the pandemic (January 2020) and after it (September 2020), which show how much the pandemic worsened the long-run debt outlook.
As the chart above shows, the US federal debt to GDP ratio jumped to about 125% in fiscal 2020, roughly the post-war peak (U.S. Debt to GDP Ratio 1989-2025 | MacroTrends). That underlines how much the fiscal and monetary stimulus during the pandemic affected debt and the money supply. The federal deficit that year reached $3.3 trillion, about 16% of GDP, the highest deficit ratio since 1945 (National debt of the United States - Wikipedia). The Fed and financial markets absorbed the flood of new Treasury issuance, and the debt ratio shot up 21 percentage points in a short period, the largest annual increase since 1948 (What is the US debt ceiling and how has it changed over time? | USAFacts). At the same time the M2 money stock grew about 25% in the single year 2020, while GDP growth was -2.3% nominal and -3.4% real, which drove the velocity of money to a record low (Powell vs. the Pandemic: Some Simple Monetary Arithmetic). The data show that when the economy takes a hit, government debt and the money supply tend to rise together while GDP falls for a while because of lags, so the three diverge temporarily. As the economy recovered, GDP growth later outpaced money growth, and the debt ratio stabilized and even came down.
To sum up, the dynamic relationship among GDP, money supply, and federal debt depends on the policy mix and the phase of the cycle. In the recession response phase, fiscal expansion (debt up) plus monetary easing (money up) limits how far GDP falls, but the money/GDP ratio spikes and velocity drops. In the recovery and expansion phase, fiscal and monetary policy turn neutral or tighten, GDP grows while the debt ratio and money growth slow, and velocity picks back up. Over the long run GDP and the money supply grow roughly in step, while the debt to GDP ratio depends on fiscal sustainability and the gap between growth and debt. A relationship this complicated has to be analyzed in its specific context. What follows examines the interaction through two key historical moments, the 2008 financial crisis and the 2020 pandemic.
Key Historical Moments and How the Three Interacted
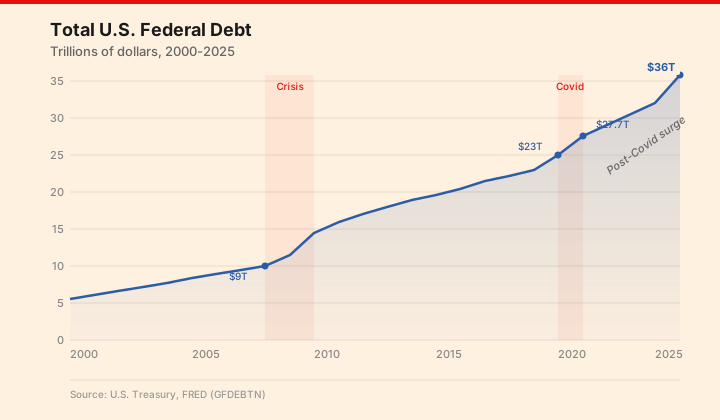 Chart: total US federal debt (trillions of dollars, 2000 to 2025). Debt climbs from $5.7 trillion in 2000 to $36 trillion in 2025, with step jumps during the 2008 financial crisis and the 2020 pandemic in particular.
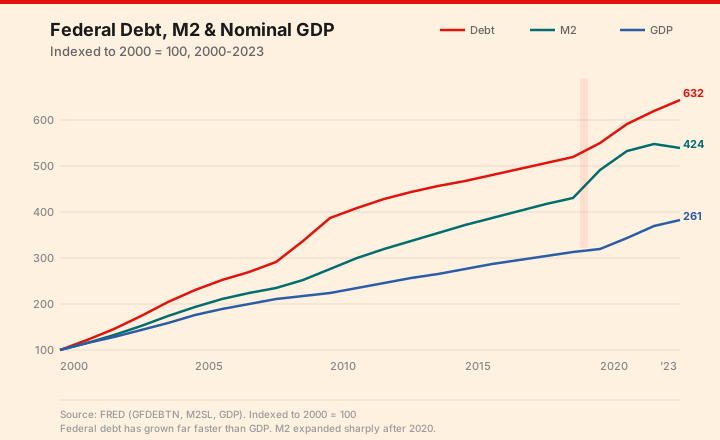 Chart: growth in federal debt, the M2 money supply, and nominal GDP compared (2000 = 100). Federal debt grows much faster than GDP or the money supply, reaching more than six times its 2000 level by 2023, while nominal GDP is only 2.6 times. The persistent divergence in these growth rates is at the center of the current debate about fiscal sustainability.
The 2008 Financial Crisis: Credit Crunch and Massive Easing
The 2008 financial crisis triggered a set of policy responses without precedent, with lasting effects on federal debt, the money supply, and GDP. Before the crisis the economy showed signs of overheating, the Fed had raised rates in a series of steps to 5.25% by 2006, and M2 velocity held around 1.9 between 2005 and 2007. Then the housing crash and problems in the banking system caused financial conditions to deteriorate rapidly in the second half of 2008, and the supply of credit froze. GDP contracted about 4% cumulatively from Q4 2008 to Q2 2009, and unemployment soared. To fight the recession the Fed started cutting rates sharply in late 2007, took the funds rate to near zero by the end of 2008, and began unconventional measures. On the money supply side, base money surged because of the Fed's rescue operations (the balance sheet went from about $0.9 trillion to $2.3 trillion between 2008 and 2010), but banks piled most of the new money up as excess reserves, so M2 growth rose only moderately (M2 Money Supply Growth vs. Inflation - Updated Chart | Longtermtrends). The data show M2 year over year growth briefly topped 10% in 2009, the worst of the crisis (M2 Money Supply Growth vs. Inflation - Updated Chart | Longtermtrends), above the usual 5% or so, which reflected the central bank's liquidity injection and a flight to safety that raised deposits. But because the money multiplier fell and the velocity of money dropped sharply (from about 1.9 at the start of 2008 to about 1.7 in 2009 (Table Data - Velocity of M2 Money Stock | FRED | St. Louis Fed)), nominal GDP did not grow along with it, and inflation pressure fell instead. You could say the extremely loose policy at the time was mainly filling a liquidity hole in the financial system, and did not immediately translate into proportional GDP growth, which is evidence of how loose the short-run link between money and GDP is.
Federal debt, meanwhile, climbed fast during the crisis. To rescue markets and stimulate the economy, the US government ran a series of fiscal measures (TARP, the American Recovery and Reinvestment Act stimulus in early 2009, and others). The federal budget went from close to balance in 2007 to a deficit of nearly 10% of GDP in 2009, and total debt rose sharply across fiscal 2008 to 2010 (Table Data - Federal Debt: Total Public Debt | FRED | St. Louis Fed) (Table Data - Federal Debt: Total Public Debt | FRED | St. Louis Fed). Specifically, federal debt jumped from about $9 trillion in 2007 (about 65% of GDP) to about $13.5 trillion by early 2010 (about 91% of GDP) (Table Data - Federal Debt: Total Public Debt | FRED | St. Louis Fed) (Table Data - Federal Debt: Total Public Debt | FRED | St. Louis Fed). The debt ceiling was raised several times in this period. In October 2008 and February 2009, Congress quickly raised the ceiling to accommodate the financing needs of the rescue and stimulus programs, so that legal limits did not hold the debt back. GDP fell and debt rose over this stretch, so the debt to GDP ratio climbed steeply. At the same time the Fed's low rates reduced the interest burden on the government's new debt, which to some extent eased the drag that high debt puts on the economy. 2008 to 2009 is therefore a textbook pattern: economic crisis, then heavy government borrowing to rescue plus central bank liquidity, then more money with lower velocity, then GDP gradually stabilizing and rebounding. By 2010 to 2013 the economy was recovering slowly, real GDP was growing again (about 2% a year), but money growth stayed high, so velocity kept sliding to a low of about 1.5. The federal debt ratio kept rising over this period and crossed 100% for the first time around 2013 (U.S. Debt to GDP Ratio 1989-2025 | MacroTrends). Then from 2014 to 2019, GDP expanded steadily, the deficit shrank relative to GDP, the debt ratio grew more slowly, M2 growth and nominal GDP growth were fairly close, and velocity was basically stable around 1.4 (Table Data - Velocity of M2 Money Stock | FRED | St. Louis Fed).
The 2020 Pandemic: Unprecedented Swings in All Three
The 2020 Covid pandemic is a more extreme case, with the relationship among the three changing violently over a short period. The outbreak sent the US economy into a rapid decline in the spring of 2020: real GDP fell more than 30% at a seasonally adjusted annual rate in the second quarter, and unemployment hit 14.8%. To keep the economy out of a depression, the government and the Fed rolled out relief on an unprecedented scale. On the fiscal side, the federal government put out more than $3 trillion of stimulus in fiscal 2020 (direct cash payments, expanded unemployment benefits, small business loan subsidies, and more), which took the budget deficit that year to $3.1 trillion, around 15% of GDP (National debt of the United States - Wikipedia). Federal debt jumped from about $23 trillion at the end of 2019 to about $27.7 trillion at the end of 2020, an increase of roughly $4.5 trillion in one year, which raised debt as a share of GDP from 100% to about 125% (U.S. Debt to GDP Ratio 1989-2025 | MacroTrends). That much new debt was financed mainly by issuing Treasuries, and the Fed matched it closely on monetary policy, cutting rates to zero and launching an unlimited asset purchase program (QE). Between March and December 2020 the Fed bought about $3.4 trillion of assets, including Treasuries and agency MBS, absorbing a large share of the deficit over the same period. The base money created as the Fed's balance sheet expanded went into the banking system, and most of it ended up sitting in household and business deposit accounts.
The M2 money supply grew at a record pace as a result: from February 2020 to February 2021, M2 went from $15.5 trillion to about $19.7 trillion, an increase of about $4.2 trillion in a year, a rise of 27% (The Rise and Fall of M2 | St. Louis Fed). That rate was unprecedented, well above anything after 2008. Besides the Fed's bond buying loosening credit, much of the M2 surge came from fiscal policy putting money directly into the private sector (relief checks, PPP loans, and so on), which households and firms parked as deposits, counted in M2 (The Rise and Fall of M2 | St. Louis Fed). But because consumption was constrained and business investment shrank during the pandemic, a lot of that money sat in bank accounts instead of turning into spending, so the velocity of money fell off a cliff: M2 velocity went from 1.4 at the start of 2020 to about 1.1 in the second quarter, the lowest since the Second World War (Powell vs. the Pandemic: Some Simple Monetary Arithmetic) (Velocity of M2 Money Stock | Chart & Indicators). The denominator (M2) surged while the numerator (GDP) shrank, so with the two moving apart velocity naturally collapsed. Weak velocity offset the inflationary effect of the money surge at the time, and inflation in 2020 came in below 2%. Put plainly, many Americans who got relief money chose to save it or pay down debt rather than spend it right away, which slowed the transmission from money to prices and output.
From the second half of 2020, as the pandemic eased and the economy reopened, things started to change. Third quarter GDP rebounded hard (+33% annualized quarter over quarter), but real GDP for the full year still fell 3.5%, and nominal GDP fell about 2%. Federal debt and M2 were both at a high plateau by then. The fiscal 2021 deficit came down a little but was still over $2 trillion, debt kept growing and reached about $29.6 trillion by the end of 2021 (Table Data - Federal Debt: Total Public Debt | FRED | St. Louis Fed), and M2 kept expanding at a double digit rate through 2021, peaking at $21.7 trillion in early 2022, about 40% above its pre-pandemic level (Table Data - M2 | FRED | St. Louis Fed). The fast recovery and supply chain bottlenecks pushed inflation up, and as some economists expected, the effect of the large monetary expansion on prices started showing up about a year later (The Rise and Fall of M2 | St. Louis Fed). US PCE inflation started rising in early 2021 and hit a 40 year high in 2022. That fits Friedman's monetarist view that the transmission from a money supply shock to inflation comes with "long and variable lags", roughly a year here (The Rise and Fall of M2 | St. Louis Fed). The Fed started tapering QE in March 2021 and began raising rates in March 2022 to deal with inflation.
By 2022 to 2023, the relationship among the three had changed again: GDP grew fast in nominal terms (partly because of high inflation), federal debt kept rising but more slowly, and the M2 money supply stopped growing and even fell a little (The Rise and Fall of M2 | St. Louis Fed). Nominal GDP grew about 9% over 2022, but M2 growth fell quickly from its high and turned negative: the M2 balance in March 2023 was about 2.4% lower than a year earlier, the first annual decline since the 1940s (Why the US money supply is shrinking for the first time in 74 years | Goldman Sachs) (Why the US money supply is shrinking for the first time in 74 years | Goldman Sachs). The cause was the Fed's fast tightening (the rate hikes and balance sheet runoff described above), which pushed money out of the components of M2. Even with M2 falling, nominal GDP still grew in 2022, so the velocity of money rose again to above 1.2 (Upon Further Review: Money Supply & The Velocity of Money). That means the money that had piled up earlier was starting to be spent. Economists argue that money supply measures have weak predictive power in a modern economy, and that the effect on GDP of overall tightening in financial conditions deserves more attention (Why the US money supply is shrinking for the first time in 74 years | Goldman Sachs). Goldman Sachs research, for example, argues that market price measures such as the financial conditions index have a more reliable relationship with GDP than the quantity of M2 (Why the US money supply is shrinking for the first time in 74 years | Goldman Sachs). As it turned out, inflation stayed high through 2022 and 2023 despite M2 contracting, because of the earlier excess money and the supply shock from the war in Ukraine, which kept the Fed tightening.
Taking 2008 and 2020 together: in a crisis, fiscal and monetary policy working in tandem push federal debt and the money supply up sharply at the same time, which stabilizes GDP and turns the slide around quickly. After the crisis, policy turns restrictive to guard against inflation and financial risk, money growth slows or contracts, and GDP growth returns to normal. Without these two large interventions, the level of US GDP would have been much lower than it actually was. (What is the US debt ceiling and how has it changed over time? | USAFacts)The data show that the pandemic shock alone brought the US federal debt burden to a level ten years ahead of schedule: the 98% of GDP threshold had been expected in 2030, and it was reached in 2020 (13 Charts That Show the Stunning Impact of 2020 on Our Fiscal and Economic Outlook). At the same time, the latest CBO projections show that unless policy changes, US debt as a share of GDP will approach twice GDP by 2050 (13 Charts That Show the Stunning Impact of 2020 on Our Fiscal and Economic Outlook), which creates uncertainty for both monetary policy and growth. Against that background, we need a theoretical framework to understand how the relationship among the three has evolved, and where it may go.
What Mainstream Economic Theory Says
Economics has many theories about the relationship among government debt, the money supply, and GDP. The mainstream views include monetarism, Keynesianism, and Modern Monetary Theory (MMT), which has drawn attention in recent years. Each explains the interaction from a different angle.
1. The monetarist view. The monetary school, with Friedman as its leading figure, holds that "inflation is always and everywhere a monetary phenomenon", and that changes in the money supply have the largest determining effect on nominal GDP, and on the price level in particular (The Rise and Fall of M2 | St. Louis Fed). The basic theory is the quantity theory of money: $MV = PY$ (money * velocity = prices * output, that is, nominal GDP). If velocity and the growth of potential output are stable, money growing too fast leads directly to inflation and a rising nominal GDP. Monetarists therefore argue that central banks should keep money growth steady. Friedman proposed a fixed annual growth rate for the money supply to avoid large swings in the economy. By this theory, in 2008 and in 2020 the large expansion of M2 must eventually push nominal GDP up, unless velocity drops to offset it. In fact, monetarists read the high inflation of 2021 to 2022 as the lagged response to the extraordinary money creation of 2020 (The Rise and Fall of M2 | St. Louis Fed). Monetarism does allow for "long and variable lags", though, so the effect of monetary policy is not immediate. It also holds that sustained large fiscal deficits, if financed by the central bank (printing money), will cause serious inflation. Government debt bought in bulk by the central bank amounts to an increase in the money supply, which raises nominal GDP but does not necessarily raise real output, and may produce inflation instead. Monetarism was influential in the 1960s and 1970s, but because variables like velocity turned out to be unstable in the real economy, central bank practice later moved away from it (The Rise and Fall of M2 | St. Louis Fed).
2. The Keynesian view. Keynesianism stresses effective demand as the determinant of output, and argues for fiscal and monetary stimulus to fill the demand gap when the economy is weak. Keynesians do not treat the money supply as an independent driver, but see it as largely determined endogenously by credit demand and economic activity (the "endogenous money" theory). The central bank mainly affects investment and consumption decisions through interest rates. When the economy is in a liquidity trap (rates near zero after 2008), adding money alone need not lift GDP, because nobody wants to borrow, and active fiscal policy is required. Keynesians explain the low inflation in the US after 2008 this way: even though the monetary base multiplied several times over, banks were reluctant to lend and the public preferred liquidity, so the money multiplier fell, broad money did not rise proportionally, and weak aggregate demand kept GDP from recovering fully. In that situation, expanding government debt to fund spending raises aggregate demand and GDP directly, the fiscal multiplier effect. The large fiscal stimulus during the 2020 pandemic did drive a fast GDP rebound, which bears this out. Keynesians are also not worried about a short-run spike in debt. As long as there is idle capacity in the economy, borrowing to spend (even with the central bank buying the debt) will not cause immediate inflationary pressure, and is in fact necessary. The difference from monetarism is the direction of causation: Keynesians hold that economic activity determines money demand and so the money supply, through banks creating deposits by lending, while monetarists put more weight on the central bank supplying money and thereby changing spending. What the two share is agreement that too much money over the long run brings inflation, but in a downturn Keynesians are more willing to add debt to stimulate GDP. On high debt, Keynesians care about the effect of interest costs through crowding out. If debt drives rates up and crowds out private investment, long-run growth suffers, but when rates are controlled or the economy has slack, that crowding out is limited. That is why federal debt doubled during the 2010s without noticeably suppressing GDP growth: the central bank kept rates very low, financing costs stayed cheap, and the private sector was not fully crowded out.
3. Modern Monetary Theory (MMT). MMT, a focus of recent debate, offers an extreme but instructive view of government debt and the money supply. It holds that for a country with a sovereign currency, a government deficit equals a private sector surplus, and the government can meet its payment obligations by printing money (with the central bank buying its bonds), so it cannot "go bankrupt" the way a household or a firm can. The level of government debt is therefore not a binding constraint. The only real constraint is inflation. If there are plenty of idle resources, the government can safely spend more (adding debt and money) to raise GDP, until inflation appears and it cools things down with taxes and tightening. MMT supporters even argue for abolishing the debt ceiling, on the view that an artificial cap on debt blocks necessary fiscal action. By MMT logic, US policy after 2008 and in 2020 actually bore them out: huge debt and money creation did not cause anything to spin out of control in the short run, and helped GDP recover. Mainstream economists worry that MMT underestimates expectations and debt risk. After the high inflation of 2021 to 2022, MMT drew skepticism as well. Still, MMT is a reminder that as long as debt is denominated in the country's own currency, the government can always avoid nominal default by having the central bank buy it, though the price may be a loss in the value of the currency (inflation or a falling exchange rate). MMT differs from traditional monetarism on whether inflation rather than debt is the policy red line. Both accept that printing too much money eventually pushes prices up, but MMT advocates are bolder about using it to support GDP growth even as debt climbs.
4. Empirical work on debt and growth. Mainstream macro analysis also studies the effect of high debt on long-run GDP growth. Some research (Reinhart and Rogoff, among others) argues that when government debt exceeds 90% of GDP, growth may be lower (the so-called "90% curse"), because high debt can raise interest rates and expectations of higher taxes, which suppresses investment. This conclusion is disputed, and the more recent consensus is that there is no clear absolute threshold at which debt affects growth. What matters is whether the borrowed money goes into productive investment, and whether financial markets have confidence in debt sustainability. If high debt comes with high savings and steady low rates (Japan, where debt is more than twice GDP but yields are extremely low), GDP can still grow normally in the short run. But if the debt expansion goes mostly into consumption rather than investment, it may drag on productivity over the long run. High debt also limits the fiscal room a government has to handle the next crisis, and increases reliance on the central bank, which can distort the direction of monetary policy (the central bank may lean toward inflation to lighten the debt burden). The mainstream view is therefore that moderate growth in debt and money helps stabilize GDP growth, while too much of either raises risk sharply.
Taken together, the mainstream theories offer different angles: monetarism stresses the money supply as the determinant of nominal GDP (with a focus on controlling inflation); Keynesianism stresses managing demand through debt financing (with a focus on real GDP and employment); MMT stresses policy actively creating demand (with inflation as the only constraint). Actual policy usually compromises among them. The Fed in practice has taken the monetarist lesson about avoiding sustained over-issuance while using Keynesian tools to open the taps in a crisis and tightening afterwards. For a reserve currency country like the US, raising the debt ceiling and adding debt in the short run is often necessary and workable, but over the long run growth and fiscal consolidation are still needed to keep debt/GDP in a manageable range. If debt and money are allowed to expand without limit while GDP does not keep up, high inflation or financial instability will eventually arrive.
Recent Developments and Future Trends
As of 2025, the interaction among the US debt ceiling, money supply, and GDP faces new tests and is still evolving. Recent developments include the 2023 debt ceiling fight, the Fed's turn from easing to tightening, and the economy rebalancing after high inflation.
Latest on the debt ceiling. In the first half of 2023 the US faced another debt ceiling crisis. Federal debt hit the statutory limit of $31.4 trillion in January 2023, and the Treasury was forced into extraordinary measures to keep paying, warning that it could run out of cash as early as June (What is the US debt ceiling and how has it changed over time? | USAFacts). After drawn-out negotiations between the two parties, Congress passed the Fiscal Responsibility Act in June 2023, which suspended the ceiling until January 2, 2025 (U.S. Debt Ceiling: Definition, History, Pros, Cons, and Clashes). That lifted the constraint temporarily and let the government keep borrowing through 2024. It did not solve the debt problem, though: by early 2025 the total had passed $36 trillion and was above the ceiling again (U.S. Debt Ceiling: Definition, History, Pros, Cons, and Clashes). The Treasury is currently using extraordinary measures to avoid default, and Congress needs to raise or abolish the ceiling before the suspension ends, or default risk remains. Another round of political maneuvering in 2025 looks likely. Markets are watching closely, but also expect the two parties to avoid an actual default in the end, because a default would badly damage both US GDP and its financial standing. One possible direction is finding an alternative mechanism so the debt ceiling stops becoming a recurring threat. Some have proposed abolishing it (on the view that spending decided in the budget should automatically authorize the borrowing), or invoking the Fourteenth Amendment so the executive branch can ignore the ceiling and issue debt directly (U.S. Debt Ceiling: Definition, History, Pros, Cons, and Clashes). In the short run, though, the ceiling will stay a source of policy uncertainty, and the negotiations are worth following.
The Fed and the new state of the money supply. After the aggressive hikes of 2022, the Fed slowed its pace in 2023 and moved into a wait-and-see period, with the funds rate held high at around 5.25%. The high rate environment has clearly affected the money supply: M2 was still falling slightly or flat year over year in the first half of 2023 (Why the US money supply is shrinking for the first time in 74 years | Goldman Sachs). Broad money in the US has almost never contracted in absolute terms, the last time being the 1940s (Why the US money supply is shrinking for the first time in 74 years | Goldman Sachs). That shows how unprecedented the current tightness is, and the reasons behind it are twofold. First, the Fed is running quantitative tightening (QT), shrinking its bond holdings each month, which reduces commercial bank deposits. Second, high rates are pushing savers to move money from demand deposits into money market funds and short-term Treasuries, which are not counted in M2 (Why the US money supply is shrinking for the first time in 74 years | Goldman Sachs). Even so, overall liquidity in the US financial system remains relatively ample, and nothing major has broken (the localized deposit flight from small and mid-size banks in 2023 was contained once the Fed and the FDIC stepped in). Steadier money growth also helps hold inflation down. By early 2024, US inflation had come down from its 9% peak to the 3 to 4% range. High rates do put lagged pressure on GDP, though, and the slowdown is showing in real estate and manufacturing investment in particular. So the Fed may stop hiking, and may even consider cuts in 2024 to 2025 to engineer a soft landing. Once a cutting cycle starts, money growth may pick up and M2 could expand moderately again. That will be another balancing act: providing enough liquidity to support growth without feeding inflation again. The Fed is also watching how financial markets react to the high level of debt, since the ever-growing supply of Treasuries needs buyers. From the second half of 2023, global investor demand for Treasuries slowed and the 10 year yield rose to a 16 year high, which reflects both the high rate environment and market concern about the US fiscal path. The Fed may end up having to trade off staying tight against keeping the bond market stable. If the economy clearly weakens (a mild recession, say), it is possible the Fed eases again, or even pauses QT. All of these moves would affect the money supply and the debt financing environment.
GDP and the fiscal outlook. US real GDP was still growing in 2023 (about 2% for the year), better than many developed economies. Looking ahead, as the lagged effects of monetary policy show up and the global economy slows, US GDP growth may slow, and there is some risk of a brief recession in 2024. With debt high and rates high, there is limited room for fiscal stimulus. If GDP slows and rates do not come down in time, the debt to GDP ratio may rise again (a smaller denominator and a larger interest burden in the numerator). According to the Congressional Budget Office's latest projection (February 2024), under current law federal debt as a share of GDP rises from about 99% in 2024 to 116% in 2034, and reaches a startling 172% by 2054 (National debt of the United States - Wikipedia). That trajectory is clearly unsustainable and would weigh on the economy. To avoid losing control of the debt, the US needs either faster nominal GDP growth than expected (through technology raising productivity, or through some degree of inflation diluting the debt), or fiscal reform to cut the deficit (higher taxes or lower spending). Politically, large tax increases and cuts to Social Security and Medicare are both very hard, so moderate inflation plus steady growth is seen as the realistic path to lightening the debt burden. That implies the Fed may tolerate inflation slightly above 2% for a while so that nominal GDP can outrun the debt (National debt of the United States - Wikipedia). Handled badly, though, this strategy can unanchor inflation expectations and create new problems.
Possible future trends. Putting it all together, the relationship among US debt, money, and GDP over the next few years may look like this. 1) Hitting the debt ceiling becomes routine. As the total grows, unless Congress abolishes the ceiling it will be reached every year or two and require a political fix. That uncertainty disturbs markets by itself, but all sides also tend toward compromising in time so a default does not become a "black swan". 2) Money growth returns to normal. After the surge of the pandemic and the sharp drop in 2022 to 2023, M2 growth may settle back to a low to moderate level roughly in line with nominal GDP growth (around 5% a year), which keeps prices stable. The Fed will operate more flexibly once inflation has come down, but will try to avoid letting money grow abnormally again, barring a major new crisis. 3) GDP growth depends on productivity, immigration, and other structural factors. With the labor force growing more slowly, the US needs higher productivity to sustain nominal growth above 3%, or it risks "stagflation" under high rates. If growth is weak and the deficit cannot be controlled, the eventual result may be a replay of fiscal and central bank "financial repression", using higher inflation to work off the debt. 4) International factors. As the world's largest economy, US debt and monetary policy are also affected by international capital flows. If foreign investors buy fewer Treasuries (for geopolitical reasons, or to diversify their own reserves), Treasury yields would be forced up and the dollar could weaken, which affects domestic inflation and rates and in turn GDP. That means watching what the major holders of Treasuries (Japan, China, and others) do, and how global liquidity conditions change. Overall, the current US debt and money situation is under strain but still manageable, with no sign of an immediate debt crisis: confidence in dollar assets remains, which lets the US government finance an enormous debt at relatively low cost. But this "privilege" is not unlimited, and over the long run restoring fiscal health and keeping money stable is what keeps GDP growing.
Conclusion
The relationship among the US debt ceiling, money supply, and GDP runs through every part of fiscal policy, monetary policy, and how the macroeconomy works. The debt ceiling is a statutory constraint meant to encourage fiscal prudence, but in practice it usually turns into a political contest that disturbs markets and the economy. The Fed affects the money supply and financial conditions by adjusting rates and its balance sheet, trading off support for growth against control of inflation over and over. GDP reflects real economic activity as a whole, determines the debt burden and the demand for money, and is affected by both in turn. History shows that in a crisis the three change in strikingly "abnormal" ways: debt and money jump to keep GDP from collapsing. In normal times they tend to adjust slowly back toward equilibrium. Over the long path since the Second World War, the US has brought its wartime debt ratio down a great deal through growth and inflation, and has also gone through several rounds where the ratio spiked because of recession. Right now it is once again in an adjustment period after high debt and high inflation, facing the challenge of bringing inflation and the debt ratio down without tipping the economy into recession. What mainstream theory suggests is that the inflation risk from too much money cannot be ignored, and neither can the importance of fiscal support to a recovery. The US will most likely go with a combination of moderate fiscal tightening plus flexible monetary policy, keeping debt growth steadily below nominal GDP growth so that the ratio of debt to GDP improves gradually (National debt of the United States - Wikipedia). The debt ceiling problem may eventually be defused through legislative reform, and the money supply will return to a normal path driven by economic fundamentals. Along the way, continuing to watch the data on debt, money, and GDP and how they affect each other helps catch the early signs of risk and prepare a response.
References
- Investopedia. (2025). U.S. Debt Ceiling: Definition, History, Pros, Cons, and Clashes. Retrieved from https://www.investopedia.com/terms/d/debt-ceiling.asp
- Wikipedia. (2025). National debt of the United States. Retrieved from https://en.wikipedia.org/wiki/National_debt_of_the_United_States
- Federal Reserve Bank of St. Louis. (2023). The Rise and Fall of M2. Retrieved from https://www.stlouisfed.org/on-the-economy/2023/may/the-rise-and-fall-of-m2
- Richmond Fed. (1992). How Useful Is M2 Today? Retrieved from https://www.richmondfed.org/-/media/richmondfedorg/publications/research/economic_review/1992/pdf/er780502.pdf
- Goldman Sachs. (2023). Why the US money supply is shrinking for the first time in 74 years. Retrieved from https://www.goldmansachs.com/insights/articles/why-the-us-money-supply-is-shrinking
- Longtermtrends. (2023). M2 Money Supply Growth vs. Inflation. Retrieved from https://www.longtermtrends.net/m2-money-supply-vs-inflation
- Trading Economics. (2025). United States Gross Federal Debt to GDP. Retrieved from https://tradingeconomics.com/united-states/government-debt-to-gdp
- MacroTrends. (2025). U.S. Debt to GDP Ratio 1989-2025. Retrieved from https://www.macrotrends.net/global-metrics/countries/usa/united-states/debt-to-gdp-ratio
- Peter G. Peterson Foundation. (2020). 13 Charts That Show the Stunning Impact of 2020 on Our Fiscal and Economic Outlook. Retrieved from https://www.pgpf.org/article/13-charts-that-tell-the-fiscal-story-of-2020